Life Cycle Analysis

Life Cycle Analysis (LCA) is hard to do. If you Google it, the most popular links are dated. LCA is a good idea that is difficult to manage because supply chains are complex and conflicting criteria must be applied to select the best option in each link of the chain.

The goal of LCA is to compare the full range of environmental effects assignable to products and services by quantifying all inputs and outputs of material flows and assessing how these material flows affect the environment. This information is used to improve processes, support policy and provide a sound basis for informed decisions.

The term life cycle refers to the notion that a fair, holistic assessment requires the assessment of raw-material production, manufacture, distribution, use and disposal including all intervening transportation steps necessary or caused by the product’s existence.

The procedures of life cycle assessment (LCA) are part of the ISO 14000 environmental management standards: in ISO 14040:2006 and 14044:2006. (ISO 14044 replaced earlier versions of ISO 14041 to ISO 14043.) GHG product life cycle assessments can also comply with specifications such as PAS 2050 and the GHG Protocol Life Cycle Accounting and Reporting Standard.[

To implement a sustainable supply chain companies must adopt a holistic systems-based approach in which all the supply chain partners’ activities are integrated throughout the four basic lifecycle stages: pre-manufacturing, manufacturing, use and post-use.

In 2009 Walmart announced its intention to create a new sustainable product index that would establish a single source of data for evaluating the sustainability of products. The company said it would provide initial funding for a consortium of universities, suppliers, retailers, government organizations and NGOs “to develop a global database of information on the lifecycle of products – from raw materials to disposal.”

LCA attempts replace monetary cost with an energy currency. Energy efficiency is only one consideration in deciding which alternative process to employ, and that it should not be elevated to the only criterion for determining environmental acceptability; for example, simple energy analysis does not take into account the renewability of energy flows or the toxicity of waste products; however, the life cycle assessment does help companies become more familiar with environmental properties and improve their environmental footprint.

The literature on life cycle assessment of energy technology has begun to reflect the interactions between the current electrical grid and future energy technology. Some papers have focused on energy life cycle, while others have focused on carbon dioxide (CO2) and other greenhouse gases. The essential critique given by these sources is that when considering energy technology, the growing nature of the power grid must be taken into consideration. If this is not done, a given class of energy technology may emit more CO2 over its lifetime than it mitigates.

A problem the energy analysis method cannot resolve is that different energy forms (heat, electricity, chemical energy etc.) have different quality and value even in natural sciences, as a consequence of the two main laws of thermodynamics. A thermodynamic measure of the quality of energy is exergy. According to the first law of thermodynamics, all energy inputs should be accounted with equal weight, whereas by the second law diverse energy forms should be accounted by different values.

A recent article by López  (López Isabel Noya, 2018) illustrates the complexities and methodologies of LCA.

References

Bredenberg, A. (2012, March 20). Lifecycle Assessment in Sustainable Supply Chains. Retrieved from ThomasNet.com: https://news.thomasnet.com/imt/2012/03/20/lifecycle-assessment-in-sustainable-supply-chains

Florian Suter, B. S. (2016, September 26). Life Cycle Impacts and Benefits of Wood along the Value Chain: The Case of Switzerland. Retrieved from Wiley Online Library: http://onlinelibrary.wiley.com/doi/10.1111/jiec.12486/full

Gestring, I. (2017). Life Cycle and Supply Chain Management for Sustainable Bins. Retrieved from Science Direct: https://doi.org/10.1016/j.proeng.2017.06.041

López Isabel Noya, V. V.-G. (2018, January). An environmental evaluation of food supply chain using life cycle assessment: A case study on gluten free biscuit products. Retrieved from Science Direct: https://www.sciencedirect.com/science/article/pii/S0959652617319777

United Nations Environment Programme. (2009). Life Cycle Management. United Nations Environment Programme. Dublin: United Nations Environment Programme. Retrieved from http://www.unep.fr/shared/publications/pdf/DTIx1208xPA-LifeCycleApproach-Howbusinessusesit.pdf

Wharton. (2010, March 3). The Business Case for Lifecycle Analysis and Building a Green Supply Chain. Retrieved from Knowledge@Wharton: http://knowledge.wharton.upenn.edu/article/the-business-case-for-lifecycle-analysis-and-building-a-green-supply-chain/

Wikipedia. (2018, January 22). Life-cycle assessment. Retrieved from Wikipedia: https://en.wikipedia.org/wiki/Life-cycle_assessment


design of experiments

The design of experiments (DOE, DOX, or experimental design) is the design of any task that aims to describe or explain the variation of information under conditions that are hypothesized to reflect the variation. The term is generally associated with true experiments in which the design introduces conditions that directly affect the variation, but may also refer to the design of quasi-experiments, in whichnatural conditions that influence the variation are selected for observation.

In its simplest form, an experiment aims at predicting the outcome by introducing a change of the preconditions, which is reflected in a variable called the predictor. The change in the predictor is generally hypothesized to result in a change in the second variable, hence called the outcome variable. Experimental design involves not only the selection of suitable predictors and outcomes, but planning the delivery of the experiment under statistically optimal conditions given the constraints of available resources.

Main concerns in experimental design include the establishment of validity, reliability, and replicability. For example, these concerns can be partially addressed by carefully choosing the predictor, reducing the risk of measurement error, and ensuring that the documentation of the method is sufficiently detailed. Related concerns include achieving appropriate levels of statistical power and sensitivity.

Correctly designed experiments advance knowledge in the natural and social sciences and engineering. Other applications include marketing and policy making.

Design of Experiments (DOE)

Outline

  1. Introduction
  2. Preparation
  3. Components of Experimental Design
  4. Purpose of Experimentation
  5. Design Guidelines
  6. Design Process
  7. One Factor Experiments
  8. Multi-factor Experiments
  9. Taguchi Methods

In the design of experiments, optimal designs (or optimum designs[2]) are a class of experimental designs that are optimal with respect to some statistical criterion. The creation of this field of statistics has been credited to Danish statistician Kirstine Smith.[3][4]

In the design of experiments for estimating statistical models, optimal designs allow parameters to be estimated without bias and withminimum variance. A non-optimal design requires a greater number of experimental runs to estimate the parameters with the sameprecision as an optimal design. In practical terms, optimal experiments can reduce the costs of experimentation.

The optimality of a design depends on the statistical model and is assessed with respect to a statistical criterion, which is related to the variance-matrix of the estimator. Specifying an appropriate model and specifying a suitable criterion function both require understanding ofstatistical theory and practical knowledge with designing experiments.

DMAIC

DMAIC (an acronym for Define, Measure, Analyze, Improve and Control) (pronounced də-MAY-ick) refers to a data-driven improvement cycle used for improving, optimizing and stabilizing business processes and designs. The DMAIC improvement cycle is the core tool used to drive Six Sigma projects. However, DMAIC is not exclusive to Six Sigma and can be used as the framework for other improvement applications.

scatter diagram

Also called: scatter plot, X–Y graph

The scatter diagram graphs pairs of numerical data, with one variable on each axis, to look for a relationship between them. If the variables are correlated, the points will fall along a line or curve. The better the correlation, the tighter the points will hug the line.

The Seven Management and Planning Tools

The Seven Management and Planning Tools have their roots in Operations Research work done after World War II and the Japanese Total Quality Control (TQC) research.

In 1979 the book Seven New Quality Tools for Managers and Staff was published and was translated into English in 1983.

The Seven Tools

Affinity Diagram (KJ Method)

Affinity Diagram

Affinity diagrams are a special kind of brainstorming tool that organize large amounts of disorganized data and information into groupings based on natural relationships.

It was created in the 1960s by the Japanese anthropologist Jiro Kawakita. Its also known as KJ diagram,after Jiro Kawakita.When to Use an Affinity Diagram 1)When you are confronted with many facts or ideas in apparent chaos 2)When issues seem too large and complex to grasp

Interrelationship Digraph (ID)

Interrelationship Digraph

This tool displays all the interrelated cause-and-effect relationships and factors involved in a complex problem and describes desired outcomes. The process of creating an interrelationship digraph helps a group analyze the natural links between different aspects of a complex situation.

Tree Diagram

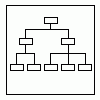
Tree Diagram

This tool is used to break down broad categories into finer and finer levels of detail. It can map levels of details of tasks that are required to accomplish a goal or solution or task. Developing the tree diagram helps one move their thinking from generalities to specifics.

Prioritization Matrix

Matrix Diagram

This tool is used to prioritize items and describe them in terms of weighted criteria. It uses a combination of tree and matrix diagramming techniques to do a pair-wise evaluation of items and to narrow down options to the most desired or most effective. Popular applications for the Prioritization Matrix include Return-on-Investment (ROI) or Cost-Benefit analysis (Investment vs. Return), Time management Matrix (Urgency vs. Importance), etc.

Matrix Diagram

Matrix Diagram

This tool shows the relationship between items. At each intersection a relationship is either absent or present. It then gives information about the relationship, such as its strength, the roles played by various individuals or measurements. Six differently shaped matrices are possible: L, T, Y, X, C, R and roof-shaped, depending on how many groups must be compared.

Process Decision Program Chart (PDPC)

Process Decision Program Chart

A useful way of planning is to break down tasks into a hierarchy, using a tree diagram. The PDPC extends the tree diagram a couple of levels to identify risks and countermeasures for the bottom level tasks. Different shaped boxes are used to highlight risks and identify possible countermeasures (often shown as ‘clouds’ to indicate their uncertain nature). The PDPC is similar to the Failure Modes and Effects Analysis (FMEA) in that both identify risks, consequences of failure, and contingency actions; the FMEA also rates relative risk levels for each potential failure point.

Activity Network Diagram

Arrow Diagram

This tool is used to plan the appropriate sequence or schedule for a set of tasks and related subtasks. It is used when subtasks must occur in parallel. The diagram enables one to determine the critical path (longest sequence of tasks). (See also PERT diagram.)

Further reading

External links

7 Step Problem Solving

Prof. Shoji Shiba is an international expert in Total Quality Management (TQM) and Breakthrough Management.[1] Globally he is best known for developing the “Five Step Discovery Process” for Breakthrough Management. In the recent years he has been guiding the transformation of the Indian manufacturing industry.

A Deming Prize winner[2] in an individual capacity for propagating TQM amongst corporates and governments, Prof. Shiba has authored books like ‘A New American TQM’ (co-authored by David Walden and Alan Graham), ‘Integrated Management Systems’ (co-authored by Thomas H Lee and Robert Chapman Wood), ‘Four Practical Revolutions in Management’ (with David Walden) in English and ‘Breakthrough Management’ (Japanese 2003; English 2006).


To handle a complex problem say for example a huge number of calls in a call center, you need the following 7 steps (defined by Dr. Shoti Shiba) to perfectly solve it:

  1. Definition: the first thing is to ask what is the problem really, without the answer of this question you cannot go any further; taking our example, you need to know what the problem really is? Is it the number of calls? Is it how long the call is taken? Or it is about something in the content of the call. Let’s decide it is the number of calls.
  2. Data Collection: next step is to answer the question “WHAT?” Get detailed data about the problem; if we are talking about the number of calls so let’s draw a graph about the number of calls over time.
  3. Cause Analysis: next step is to answer the question of “WHY?”; many techniques can help you find the cause of the problem such as Ishikawa or Pareto; or may be simple analysis, any of them will use the data collected above; in our example you found that the increase of calls synchronized with the shipment of new product, which the most of the new callas are about.
  4. Solution Planning & Implementation: “A lot of work in a simple line of writing”; after previous 3 steps you are ready correctly solve your problem by planning and implementing the solution; it worth the effort because you know you are doing the right thing; in our example you may chip to the customer a check list about the things/checks they need to go through before calling.
  5. Evaluation of Effects: Don’t stop now; you need this step as much as you need the previous 4; the question here is “DID IT WORKED?”; after shipping the check list you need to monitor and collect some data to check if the calls goes normal again.
  6. Standardization: once we found the right solution, let’s see how widely we can use it in the organization.
  7. Evaluation of The Process: after we widely spread the solution all over the organization we still not done; we need to know about the steps we have been through to solve the problem are they good to do every time we solve a problem, what are they pros and cons; so next time we do it more efficiently.

education system

“The world economy no longer pays for what people know but for what they can do with what they know.”
– Andreas Schleicher, OECD deputy director for education

[ted id=66]

Sir Ken Robinson makes an entertaining and profoundly moving case for creating an education system that nurtures (rather than undermines) creativity.

http://thelearningcurve.pearson.com/2014-report-summary/

East Asian nations continue to outperform others. South Korea tops the rankings, followed by Japan (2nd), Singapore (3rd) and Hong Kong (4th). All these countries’ education systems prize effort above inherited ‘smartness’, have clear learning outcomes and goalposts, and have a strong culture of accountability and engagement among a broad community of stakeholders.
Scandinavian countries, traditionally strong performers, are showing signs of losing their edge. Finland, the 2012 Index leader, has fallen to 5th place; and Sweden is down from 21st to 24th.
Notable improvers include Israel (up 12 places to 17th), Russia (up 7 places to 13th) and Poland (up four places to 10th).
Developing countries populate the lower half of the Index, with Indonesia again ranking last of the 40 nations covered, preceded by Mexico (39th) and Brazil (38th).

South Korea demonstrates the interplay between adult skills and the demands of employers. In South Korea young people score above average for numeracy and problem-solving skills, but are below average over the age of 30. According to Randall S Jones of the OECD, this skills decline is explained by many graduates “training for white-collar jobs that don’t exist”. This leads to a higher than average proportion failing to secure employment, and a quicker diminishing of their skills.

Developing countries must teach basic skills more effectively before they start to consider the wider skills agenda. There is little point in investing in pedagogies and technologies to foster 21st century skills, when the basics of numeracy and literacy aren’t in place.

Technology can provide new pathways into adult education, particularly in the developing world, but is no panacea. There is little evidence that technology alone helps individuals actually develop new skills.

Lifelong learning, even simple reading at home and number crunching at work, helps to slow the rate of age-related skill decline; but mainly for those who are highly skilled already. Teaching adults does very little to make up for a poor school system.

Making sure people are taught the right skills early in their childhood is much more effective than trying to improve skills in adulthood for people who were let down by their school system. But even when primary education is of a high quality, skills decline in adulthood if they are not used regularly.

In recent years it has become increasingly clear that basic reading, writing and arithmetic are not enough.
The importance of 21st century non-cognitive skills – broadly defined as abilities important for social interaction – is pronounced.

The OECD estimates that half of the economic growth in developed countries in the last decade came from improved skills.

Yves Morieux

Published on Jan 23, 2014

Why do people feel so miserable and disengaged at work? Because today’s businesses are increasingly and dizzyingly complex — and traditional pillars of management are obsolete, says Yves Morieux. So, he says, it falls to individual employees to navigate the rabbit’s warren of interdependencies. In this energetic talk, Morieux offers six rules for “smart simplicity.” (Rule One: Understand what your colleagues actually do.)

TEDTalks is a daily video podcast of the best talks and performances from the TED Conference, where the world’s leading thinkers and doers give the talk of their lives in 18 minutes (or less). Look for talks on Technology, Entertainment and Design — plus science, business, global issues, the arts and much more.
Find closed captions and translated subtitles in many languages athttp://www.ted.com/translate

Amazon


10.25.13

Amazon Stock May Be Up, but the Company Still Doesn’t Make Any Money

That glowing new bestseller, that Friday stock bump, that rosy Christmas outlook—they can’t hide that after 20 years, the company still hasn’t managed to turn a profit. Daniel Gross on whether it ever will.
Amazon.com and Jeff Bezos, its founder and chief executive officer, are having a moment. They are the subject of a new, admiring bestselling book, The Everything Store, by Brad Stone. Bezos just plunked down $250 million to buyThe Washington Post. The buoyant stock, up 64 percent in the past year, got a nice jolt on Friday as investors were enthused about its third-quarter results: revenues were up 24 percent from a year ago, and Amazon issued a positive forecast for the Christmas season. The company is killing it in books and retailing goods, has a rapidly growing cloud storage and computing business, and is getting into original content and devices. It sports an impressive market capitalization of about $166 billion.

And yet.

The company, first founded in 1994, still doesn’t make any money. In the third quarter, it reported a $41 million net loss.